.png)
Profiles
Nearby Suburbs
What Kind of People Live in Rocky River (Uralla - NSW) NSW 2358?
Diversity Levels in Rocky River (Uralla - NSW)
The proportion of the population who are not 3rd+ generation Anglo-Australians
Sources: ABS, TORREN and Microburbs, 2006 - 2023
Sources: ABS, TORREN and Microburbs, 2006 - 2023
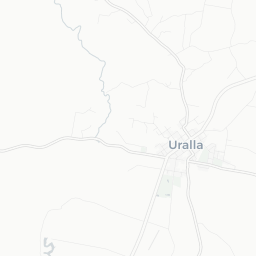
Rocky River (Uralla - NSW)
20.9%
Rocky River (Uralla - NSW)
20.9%
New England and North West
22.1%
New England and North West
22.1%
| Field | Value | VS New England and North West | Trend | |
|---|---|---|---|---|
| 48 | Top 36% |
|
||
| Premium | Premium | Premium | ||
| 8.9% | Top 9% |
|
||
| 13.0% | Bottom 42% |
|
Quality of Life in Rocky River (Uralla - NSW)

The proportion of residents who enjoy a healthy, satisfying life.
Sources: ABS, AIHW, DSS, GEOSPATIAL, GOOGLE, TORREN and Microburbs, 2006 - 2045
Sources: ABS, AIHW, DSS, GEOSPATIAL, GOOGLE, TORREN and Microburbs, 2006 - 2045
Rocky River (Uralla - NSW)
70.0%
Rocky River (Uralla - NSW)
70.0%
New England and North West
71.8%
New England and North West
71.8%
| Field | Value | VS New England and North West | Trend | |
|---|---|---|---|---|
| 3 | Bottom 42% | Data for Jun 2023 | ||
| 80 | Top 8% | Data for Dec 2016 | ||
| 75.0 | Top 38% | Data for May 2023 | ||
| 34.0 | Bottom 35% | Data for May 2023 | ||
| 87.5% | Top 38% | Data for May 2023 |
Conservatism in Rocky River (Uralla - NSW)
The proportion of the population who hold traditional values.
Sources: ABS, AEC and Microburbs, 2006 - 2023
Sources: ABS, AEC and Microburbs, 2006 - 2023
| Field | Value | VS New England and North West | Trend | |
|---|---|---|---|---|
| 63.0% | Top 33% | Data for May 2023 | ||
| 82.1% | Bottom 45% |
|
||
| 53.8% | Top 44% | Data for Dec 2022 |
Convenience Score in Rocky River (Uralla - NSW)

The higher the score, the faster the travel time to regular amenities like work and shopping and the easier it is to access them without private cars.
Sources: ABS, GEOSPATIAL, TORREN and Microburbs, 2006 - 2023
Sources: ABS, GEOSPATIAL, TORREN and Microburbs, 2006 - 2023
Rocky River (Uralla - NSW)
56.0
Rocky River (Uralla - NSW)
56.0
New England and North West
67.2
New England and North West
67.2
| Field | Value | VS New England and North West | Trend | |
|---|---|---|---|---|
| 0.0% | Bottom 35% | Data for Dec 2021 | ||
| 2.3 | Top 35% |
|
||
| 0.0% | Bottom 38% | Data for Dec 2021 | ||
| 24 km | Bottom 38% | Data for Mar 2023 | ||
| 0.0% | Bottom 19% | Data for Dec 2021 |
Hip Score in Rocky River (Uralla - NSW)
The higher the score, the more fashionable and lively an area is: a trendy, progressive population with easy access to nightlife and culture.
Sources: ABS, AEC, GOOGLE and Microburbs, 2006 - 2023
Sources: ABS, AEC, GOOGLE and Microburbs, 2006 - 2023
Rocky River (Uralla - NSW)
59.0
Rocky River (Uralla - NSW)
59.0
New England and North West
59.9
New England and North West
59.9
| Field | Value | VS New England and North West | Trend | |
|---|---|---|---|---|
| 53% | Bottom 15% | Data for Nov 2017 | ||
| 37.2% | Bottom 30% |
|
||
| 5.9% | Top 13% |
|
||
| 44.0% | Bottom 41% |
|
||
| 34.7% | Top 38% | Data for Dec 2022 | ||
| 0.0% | Bottom 37% | Data for Jan 2021 |
Community Score in Rocky River (Uralla - NSW)
The higher the score, the more time residents spend contributing the local community and the more connected residents are to their community.
Sources: ABS, GOOGLE and Microburbs, 2006 - 2023
Sources: ABS, GOOGLE and Microburbs, 2006 - 2023
Rocky River (Uralla - NSW)
94.0
Rocky River (Uralla - NSW)
94.0
New England and North West
87.1
New England and North West
87.1
| Field | Value | VS New England and North West | Trend | |
|---|---|---|---|---|
| 94.5% | Bottom 49% | Data for Dec 2014 | ||
| 44.3% | Top 30% |
|
Family Score in Rocky River (Uralla - NSW)
The higher the score, the more suitable the suburb is to families with children: good schools, safe, plentiful families, child-friendly amenities like playgrounds
Sources: ABS, DSS, TORREN and Microburbs, 2006 - 2023
Sources: ABS, DSS, TORREN and Microburbs, 2006 - 2023
Rocky River (Uralla - NSW)
66.0
Rocky River (Uralla - NSW)
66.0
New England and North West
66.8
New England and North West
66.8
| Field | Value | VS New England and North West | Trend | |
|---|---|---|---|---|
| 57 | Bottom 30% |
|
||
| 68.6% | Bottom 40% |
|
||
| 2.0% | Bottom 36% |
|
||
| Premium | Premium | Premium |
Education (1)
| Name | Address |
|---|---|
| Margaret Wood | Eden Retreat 80 Jenkyn Lane |
Businesses (2)
| Name | Address |
|---|---|
| Margaret Wood Beauty and Lifestyle Therapy | Eden Retreat 80 Jenkyn Lane |
| Rocky River Odd Jobs | Castle Dr |
Loading entities ..